When traders first come across W.D. Gann’s work, they often focus on his price tools. Gann angles, squares, and geometric levels tend to grab attention because they are visible on the chart. Time, on the other hand, is usually overlooked. It feels abstract, harder to measure, and less obvious than price.
For Gann, time was never secondary. He believed that time played an equal, and often more important, role than price in determining market movement. Markets did not move simply because price reached a certain level. They moved because the right amount of time had passed.
Understanding time cycles is one of the most important steps in learning Gann analysis. It is also one of the most misunderstood. Many traders either ignore time completely or try to use it mechanically without understanding its purpose. This article explains what time cycles really mean, how Gann used them, and how you can begin studying them in a practical and realistic way.
Gann’s core belief about time
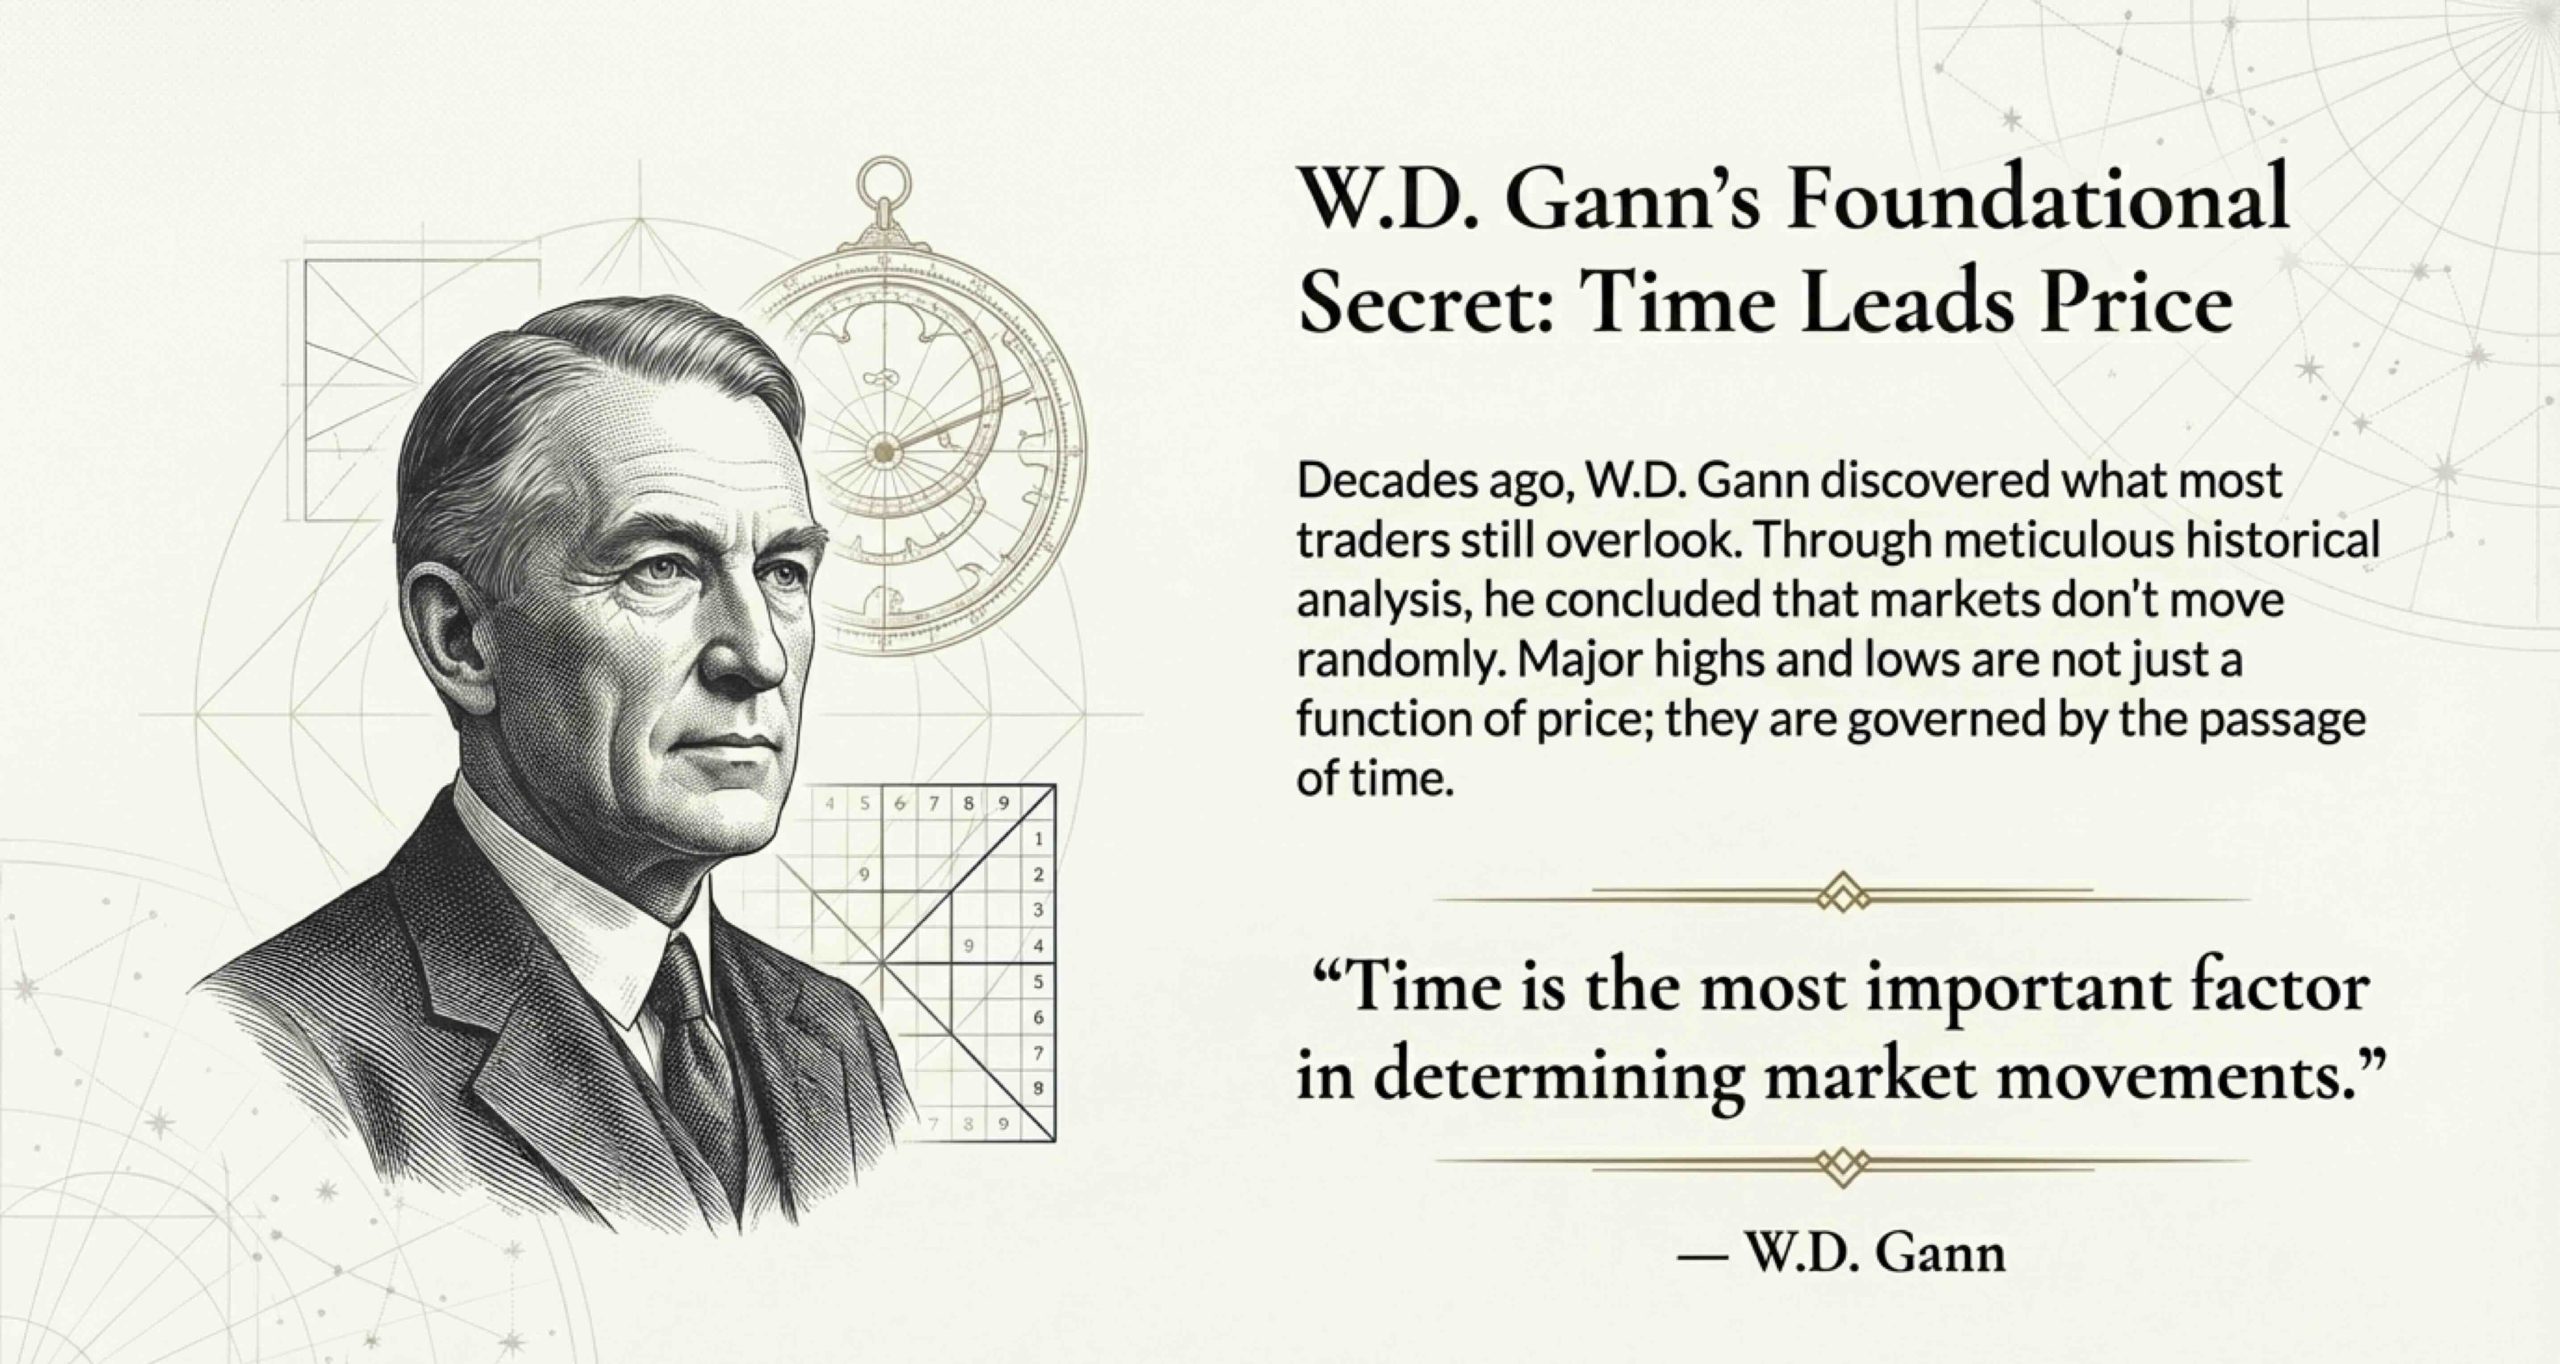
At the centre of Gann’s philosophy was a simple but powerful belief: time and price move together, and time often leads. Gann observed that markets rarely move randomly. Major highs and lows often occurred after similar amounts of time had passed from previous turning points. These repetitions were not exact, but they were consistent enough to reveal structure.
Gann reached this conclusion through years of historical analysis. He carefully studied major market highs and lows and measured the time separating them. What he found was not randomness, but repetition. Certain time intervals appeared again and again around important turning points. These intervals were not exact to the day every time, but they were close enough to suggest structure.
This belief explains why time analysis appears across all Gann tools. Whether using the Square of 9, the Square of 90, Gann angles, or planetary cycles, time is always present. Ignoring time, in Gann’s view, meant ignoring half of the market’s logic.
Time analysis was never meant to replace price analysis. Instead, it was designed to complete it. Gann did not want traders to guess where the market might turn. He wanted them to understand when the market was most likely to change character.
What is a time cycle in market terms?
A time cycle represents a period during which market energy builds, peaks, and eventually shifts. This change does not have to be a full trend reversal. It can also be a pause, a sharp correction, an increase in volatility, or a shift in momentum.
A time cycle could be measured in days, weeks, months, or years. The length depends on the market and the timeframe being analysed. A short-term trader may focus on cycles lasting a few days or weeks, while a positional trader may study cycles that unfold over months.
The key idea is repetition. If a market repeatedly shows important movement after a similar amount of time has passed, that time period becomes meaningful. WD Gann did not treat time cycles as predictions. He treated them as zones of increased importance where traders should pay closer attention. They told him when to be alert, when to study price more closely, and when to avoid emotional decision-making. This is why time cycles should never be used mechanically or in isolation.
Why time cycles give traders an edge?

Most traders focus almost entirely on price. They enter trades when price breaks a level and exit when price reacts. Without time awareness, this often leads to chasing moves that are already mature or exiting trades just before they develop.
The problem with this approach is that it ignores market rhythm. Markets tend to expand and contract over time. Trends do not last forever. Corrections do not continue endlessly. When a move has lasted for a long time, the probability of change increases, even if price has not yet shown clear signs.
Time cycles help traders understand when a market is becoming mature. A trend that looks strong on price alone may already be late from a time perspective. On the other hand, a market that looks weak may be approaching an important time cycle where strength can return.
This is one reason Gann believed that studying time could help traders avoid chasing moves too late. This understanding helps traders filter trades. Instead of asking only “Is this a breakout?”, they begin asking “Is this happening at the right time?”. That single question dramatically improves discipline and patience.
How Gann identified time cycles
Gann did not rely on fixed formulas applied blindly to every market. Instead, he studied markets historically and identified which time periods repeated most often around major turning points. He began by identifying major highs and lows, then measured the time between those points. Over long periods of observation, certain time counts repeatedly aligned with meaningful price movement.
Some cycles were short and related to minor swings. Others were longer and aligned with major tops and bottoms. Gann adjusted his focus depending on the market and timeframe he was analysing.
This approach required patience and observation. It was not about applying a formula. It was about learning how a specific market respected time. Today, traders can accelerate this learning process using structured tools and indicators rather than manual counting.
At Gann Academy, the indicators are designed to help traders visualise time cycles directly on charts. Instead of guessing or counting manually, traders can see when important time periods are approaching and prepare accordingly.
The relationship between time and market psychology
One of the reasons time cycles continue to work across different markets and eras is because markets are ultimately driven by human behaviour. Fear, optimism, greed, and hesitation do not appear instantly. They build, peak, and fade over time.
When a trend begins, participation is limited. Early movers take positions, confidence grows slowly, and price advances steadily. As time passes, more traders notice the move and join in. By the time a trend has lasted a familiar length of time, much of the available buying or selling pressure has already been used. Even without a major news event, the market becomes vulnerable to a pause, correction, or reversal.
Time cycles reflect this natural build-up and release of market emotion. When traders who study time notice that a familiar time period is completing, they become more alert. This shared awareness itself often contributes to changes in behaviour around those moments. Gann understood this psychological aspect long before it was formally studied in modern finance.
Time cycles are not exact turning points

A common misunderstanding among beginners is the belief that time cycles mark exact dates where the market must reverse. This expectation usually leads to frustration.
Gann never treated time as a trigger. He treated it as a warning system. When an important time cycle completed, it meant the market was entering a sensitive phase. Price could reverse, consolidate, or even accelerate, depending on the broader structure.
This is why time analysis should never be used in isolation. Time tells you when to pay attention. Price tells you what decision to make. At Gann Academy, this distinction is stressed repeatedly because it prevents rigid, mechanical trading based on calendar dates alone. When traders learn to respect time as a context rather than a command, their analysis becomes far more balanced and realistic.
How time cycles interact with price structure
Time becomes most powerful when it aligns with price structure. A time cycle completing in the middle of nowhere on the chart may not mean much. A time cycle completing near a major support or resistance level is far more important.
Similarly, when a key time count aligns with a Gann angle, a square level, or a known geometric relationship, that area deserves close attention. The price level itself may not look special on its own, but time adds weight to it.
This interaction is one of the reasons Gann analysis works best as a complete framework rather than a collection of disconnected tools. Time, price, and geometry support and confirm each other.
Many traders today use Gann Academy indicators to visualise these relationships more clearly. These tools help map time counts alongside price levels and angles, reducing calculation effort while keeping the logic intact. You can explore these indicators to understand how time-based analysis is applied in modern charting environments.
A simple example of time cycle analysis
Consider a market that forms a major bottom and begins an upward move. After studying historical data, you observe that this market often experiences meaningful changes after roughly ninety trading days from major lows.
As the current rally approaches that time count, you do not assume a top will form automatically. Instead, you prepare. You observe price behaviour more closely. Does momentum begin to slow? Is price struggling near a known resistance zone? Does volatility start increasing?
If weakness appears near this time window, you now have a structured reason to anticipate a possible change. If price remains strong and respects key angles or levels, you stay with the trend and wait for the next important time cycle.
This approach replaces guesswork with preparedness. Time cycles help you ask better questions rather than forcing premature answers.
Why lunar cycles are central to Gann’s time analysis
W.D. Gann paid close attention to natural cycles, including lunar movement, because markets reflect natural rhythms. Lunar cycles influence behaviour, volatility, and sentiment more consistently than most traders realise.
The Lunar Mastercourse focuses heavily on this aspect because lunar cycles provide a repeatable, observable framework for understanding market timing. Rather than relying on random time counts, traders learn how lunar phases interact with price movement, trend maturity, and volatility expansion.
This allows time analysis to become more grounded and less arbitrary. Instead of guessing when a market might turn, traders learn how to anticipate periods of increased sensitivity and prepare accordingly.
For traders who have struggled with time cycles in the past, this alone often changes how they view market timing entirely.
Common mistakes traders make with time cycles
Time analysis often fails not because it is ineffective, but because it is misused. One common mistake is trying to trade time mechanically. Counting days and expecting exact reversals turns time analysis into a rigid rule, which markets rarely respect.
Another mistake is ignoring price entirely. Time without price confirmation is incomplete. Gann never separated the two, and neither should modern traders. A third mistake is tracking too many cycles at once. Beginners often attempt to follow multiple time counts across different scales, which quickly becomes overwhelming. Instead of clarity, this creates confusion.
The most effective approach is to start with one or two recurring time cycles in a single market and study how price behaves around them. Understanding grows through repetition and observation, not complexity.
Practicing time cycle analysis the right way
The safest way to learn time cycles is through historical study. Choose a market you are familiar with and go back several years. Identify major highs and lows, then measure the time between them.
Look for repetition rather than perfection. Which time counts appear most often near important turning points? How does price behave as those periods approach and complete?
Modern charting platforms and indicators can help speed up this process by automating time measurements. However, tools should support learning, not replace it. Real understanding comes from seeing how time and price interact repeatedly across different conditions.
This is where structured guidance becomes valuable. In the Lunar Mastercourse at Gann Academy, time cycle analysis is taught using real historical charts, guided exercises, and step-by-step explanations. Instead of guessing, traders learn how to observe, test, and apply time principles with confidence.
How Gann Academy integrates time cycles with modern tools
W.D. Gann performed his analysis manually, often with pen, paper, and hand-drawn charts. Today, traders have access to far more powerful tools, but the underlying principles remain the same.
Gann Academy indicators are designed to help traders visualise time cycles alongside price structure and geometry. Rather than turning Gann’s work into automatic signals, these tools highlight areas where time and price are interacting meaningfully.
This allows traders to focus on interpretation and decision-making instead of spending hours on calculations. The goal is not automation, but clarity and discipline.
Why time cycles remain relevant in modern markets
Markets have evolved technologically, but their underlying behaviour has not changed. Institutions still operate on schedules. Economic and financial activity follows recurring rhythms. Human psychology continues to unfold over time.
Time cycles reflect these deeper patterns. They are not limited to a specific market, asset class, or era. This is why Gann’s ideas remain relevant across stocks, commodities, indices, and even newer markets.
Traders who ignore time often feel like they are always late, reacting to moves that are already mature. Traders who understand time begin to anticipate instead of react. They are prepared for change rather than surprised by it.
Understanding time cycles is not about prediction. It is about awareness. And that awareness is one of the most valuable skills a trader can develop
By starting simple, using the right indicators, and practicing consistently, you can learn to anticipate market movements with far greater clarity and confidence.
If you are serious about mastering Gann’s timeless techniques, the Lunar Mastercourse at Gann Academy is designed to guide you through the full journey.